How Should Companies Be Valued?
The short answer is it’s complicated. The longer answer is maybe history can point us in the right direction.
Given that companies have different attributes, different strategies, and operate in different economic climates, no single methodology (e.g. DCF, ARR multiples, etc.) will be the absolute source of truth on how a company should be valued. However, perhaps a more longitudinal analysis could help us derive some patterns that would provide us with some directional guidance.
To try and understand this, I thought a good starting point would be to look at an expansive data set over a long period of time to see what we can learn.
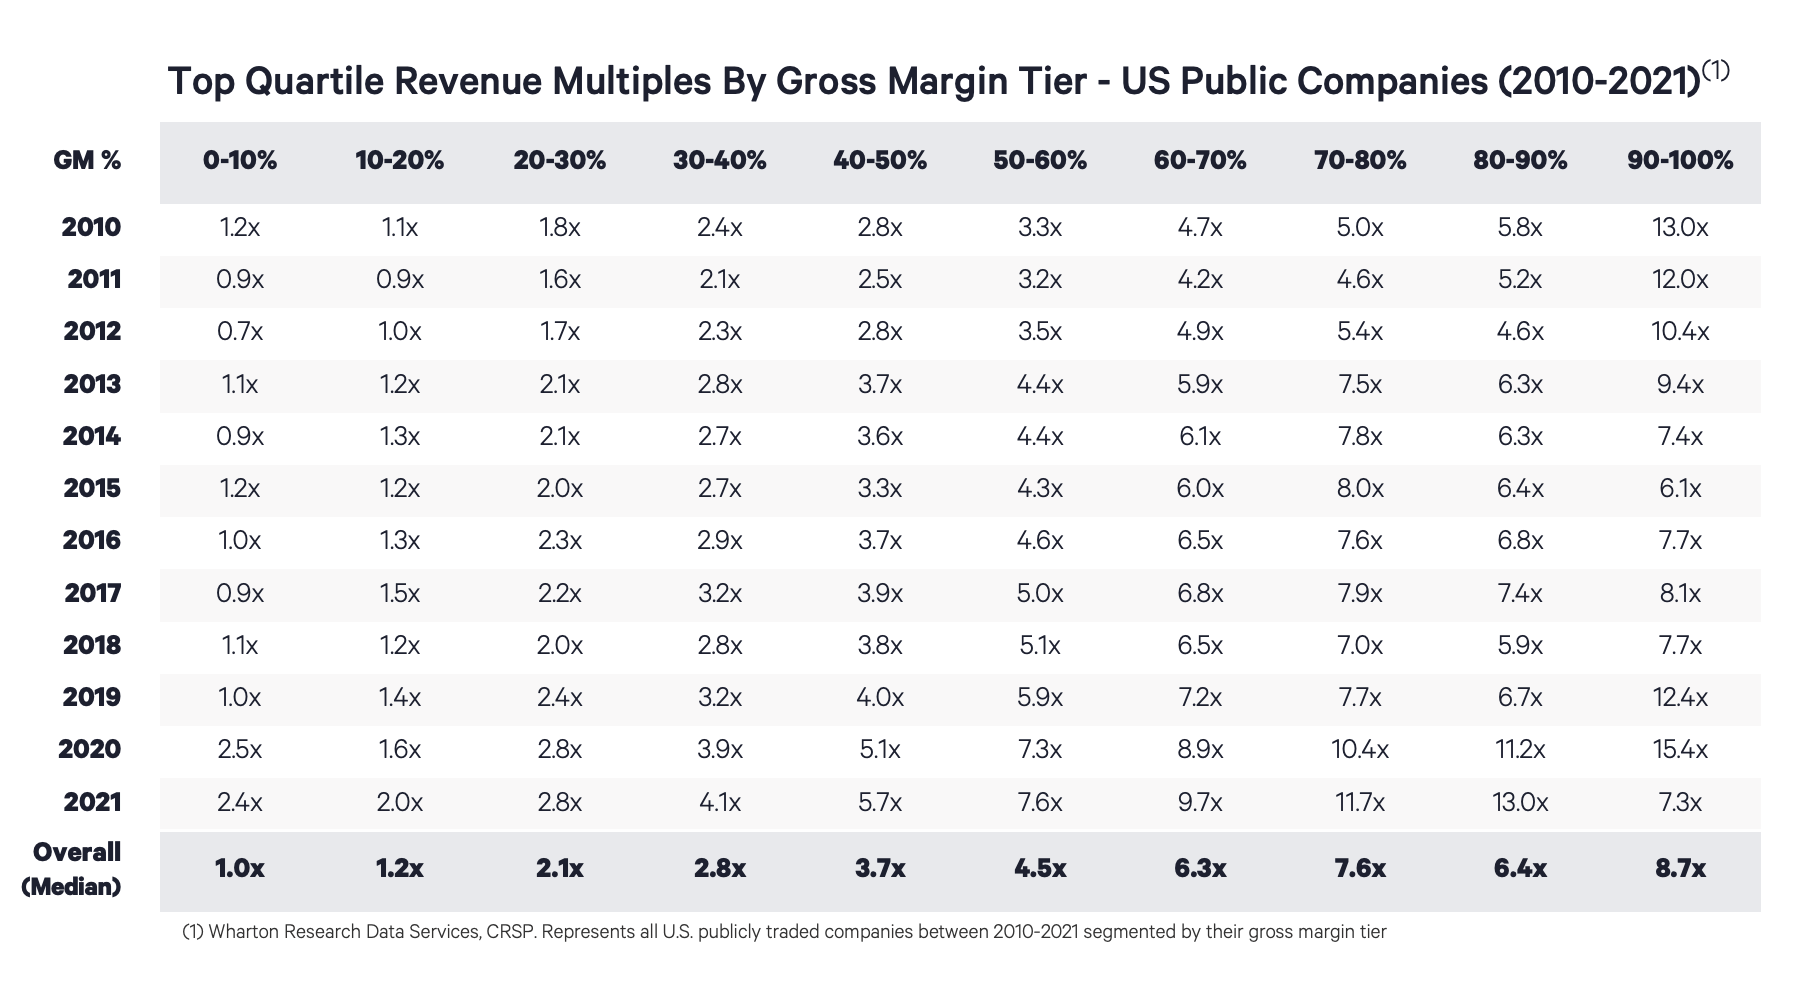
Let’s get grounded in the data. The table below reflects an 11-year view (2010-2021) of nearly all US publicly traded companies:
The top row of the table organizes all companies by their gross margin percentage (GM%). So, as an example, all US publicly traded companies with 0%-10% gross margins are represented in the far left column, and all US publicly traded companies with 90%-100% gross margins are represented by the far right column.
What the heart of the table shows is the top quartile revenue multiple for companies in that gross margin tier by year.
So as an example, the upper left corner of the table shows that for all publicly traded US companies with 0%-10% gross margins in 2010, the top quartile revenue multiple was 1.2x. Conversely, the bottom right corner shows that for all US publicly traded companies with 90%-100% gross margins in 2021, the top quartile revenue multiple was 7.3x.
Finally, the bottom row of the chart shows the median of the revenue multiples for that gross margin tier across the entire time period of 2010-2021.
Let’s take a deeper dive within one gross margin tier.

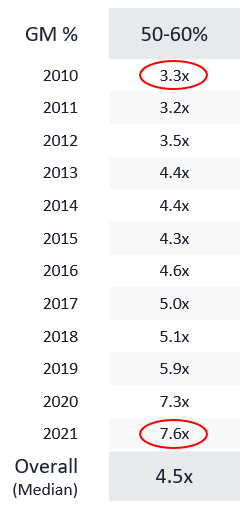
Let’s say you’re a business with 50%-60% gross margins and are wondering what your company might be valued at historically.
In 2010, in a tough economic climate coming out of the Great Recession, the top quartile revenue multiple would have been 3.3x for a company with 50%-60% gross margins. However, in 2021 after a long bull market run, the top quartile revenue multiple would have been 7.6x for companies in the same gross margin tier.
If you want a more normalized number, the median top quartile revenue multiple across the 11-year period for companies with 50%-60% gross margins is 4.5x revenues.
Here are some key takeaways from the broader data set…
- There’s roughly a 1x increase in revenue multiple for every 10% of absolute gross margin expansion.
- Multiples can more than double between a bear and bull market for companies in the same gross margin tier.
- Multiples can more than double by taking a very low gross margin business (0%-10%) into a lower gross margin business (20%-30%).
- Elite gross margin businesses (90%-100%) have less volatility across economic cycles – they always command strong revenue multiples.
It’s important to note that the revenue multiples in this table are the top quartile threshold. That means there are three quartiles worse than what’s represented in the table – presumably for companies that have weaker fundamentals and/or less attractive characteristics. Additionally, there’s a quartile of companies that trade above what’s represented for companies with premium performance.
It’s also worth noting that I’m not a believer that revenue has any intrinsic value if earnings don’t eventually follow. However our analysis centered on revenue multiples because there’s a sizable segment of publicly traded companies every year that are not profitable so it is the metric that could be applied to the entire data set.
That notwithstanding, whether valuing companies is ultimately more art or science, a retrospective look back across all US public companies could potentially provide some patterns to consider for more normalized times in the future.


