With a number of challenged IPOs, along with the recent market correction, investor sentiment is beginning to shift away from companies that pursue a growth-at-all-costs strategy. Increasingly, in both the public and private markets, we are seeing a move towards more measured value creation.
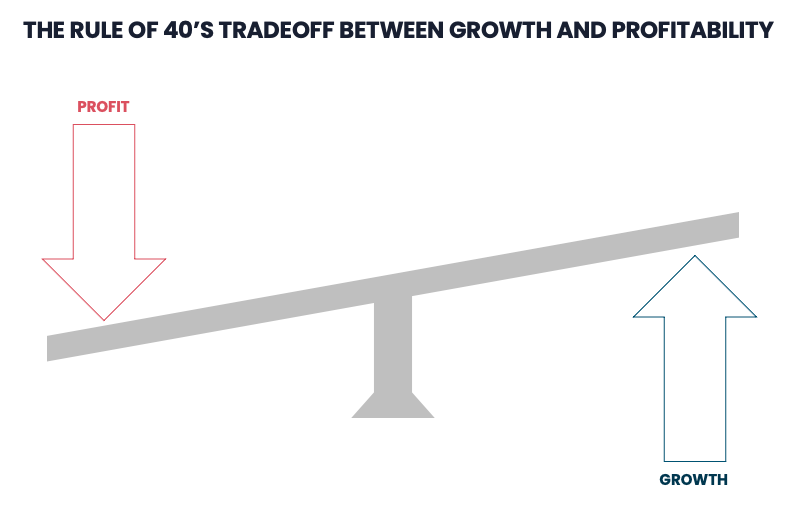
To maximize equity value, companies must balance the trade-offs between growth and profitability, depending on market factors. Companies must consider how much to invest. Where to invest. When to invest. They must measure the return on those investments via shareholder value creation. Boards must consider how much they are willing to invest (and burn) in order to drive top-line growth.
There has been a lot written about SaaS metrics and when to invest in continued growth. Due to the highly recurring nature of SaaS businesses, it can make sense to spend ahead of the curve on sales and marketing. While you may lose money in the short term, the recurring nature of a client can lead to long-term profitability for that individual client. Ultimately, the unit economics (and capital availability) should dictate a company’s willingness to spend ahead of the curve. But how does that translate into the P&L? And how do the public markets evaluate the trade-off between growth and profitability? To aid this process, there is an increasingly popular “back of the envelope” calculation used to assess the value of public SaaS companies based on the trade-off between growth and profitability.
It’s called the Rule of 40. In essence, the Rule of 40 is achieved if year over year revenue growth rate plus profitability margin equals 40%. There are, of course, exceptions to the rule of 40, but this post will focus on the formula, how it works, and how SaaS founders should use it while looking to balance growth and profitability.
This article will cover the following areas:
Rule of 40 Equation
The Rule of 40 is achieved if growth rate percentage plus profitability margin equals 40% or greater. See below for the basic Rule of 40 calculation:

Overview: The rule of 40
SaaS companies have historically been difficult to value due to guidelines on the recognition of future recurring revenue. Data on public companies would suggest that the greater the sum of a company’s growth plus profitability, the greater the revenue multiple assigned to that business. This implies that the answer to growth or profitability is not one or the other but rather the impact of one on the other. The surefire way to maximize value is to have a high growth, high profitability business in a huge market. These are extremely rare.

More common is a dynamic where a business needs to invest (and therefore lose money in the short term) to grab market share and achieve growth. But how much should a company invest? And what is the growth required to justify the upfront investment. This is where the Rule of 40 comes in. There are multiple strategies to maximize shareholder value and, as such, the Rule of 40 can be achieved in multiple ways. A 100% YoY growth business could achieve the Rule of 40 with a -60% EBITDA margin. Alternatively, a business could achieve the Rule of 40 by growing 40% YoY while operating at break-even.
The rule has become an increasingly useful metric to evaluate companies at scale, with companies achieving the Rule of 40 commanding a premium valuation.
The Volition Capital Rule of 40 Index
The Rule of 40 has been such a valuable guidepost for our conversations with entrepreneurs on the balancing act of growth and profitability that we’ve decided to build and share our Rule of 40 Index and Calculator. This tool provides a live view of the public market’s current prioritization of growth vs. profitability and allows private market entrepreneurs to plot their company’s metrics in the index to get a sense of how their financial profiles stack up.
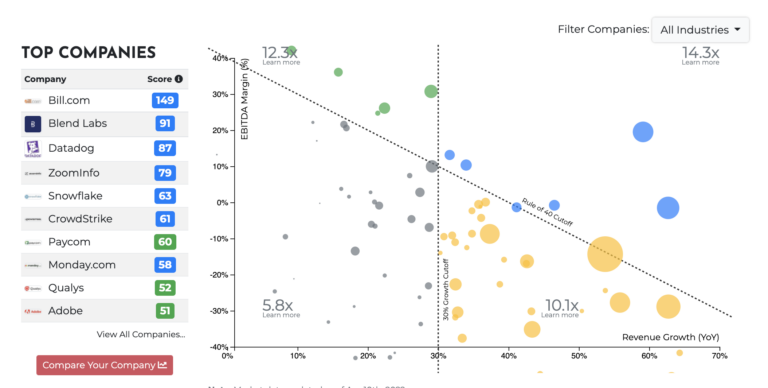
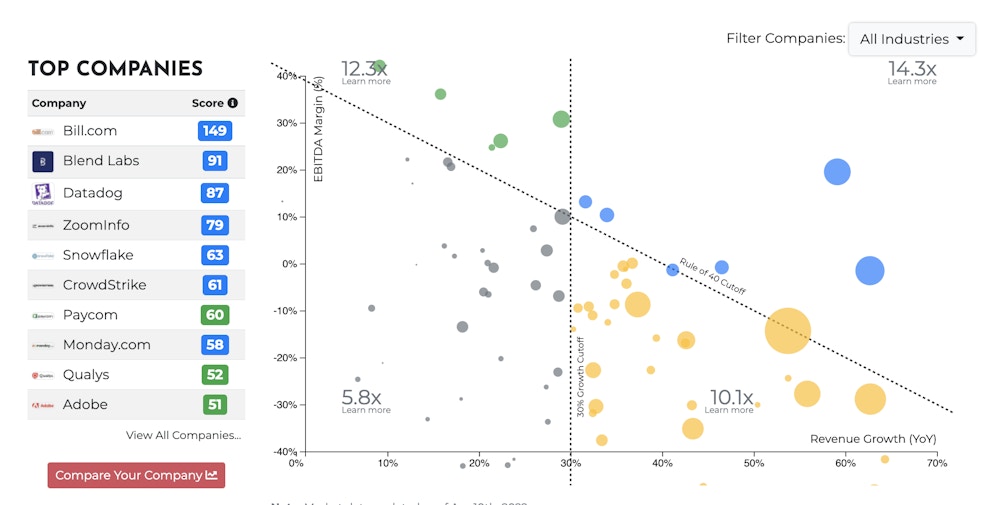
The index is an interactive graph that’s updated daily with the latest market data on publicly-traded SaaS companies. It plots their YoY revenue growth percentage vs. their EBITDA margin, with a dashed line indicating the Rule of 40 threshold. It also includes their Enterprise Value (EV)/Annualized Revenue multiple; the bigger the bubble, the higher the multiple.

Above, you will see our chart analyzing the metric. The X-axis represents growth, the Y-axis represents EBITDA Margin (profitability). The size of each bubble represents a company’s EV / Revenue multiple. The diagonal line represents the 40% intersection of profitability and growth rate, with companies on or above that line beating the Rule of 40. We’ve also added revenue growth cutoff of 30%, effectively splitting the index into four quadrants: 1) High Growth, Profitable (Top Right); 2) Low Growth, Profitable (Top Left), 3) High Growth, Less Profitable (Bottom Right), and 4) Low Growth, Less Profitable (Bottom Left).
So what does the data say? Generally speaking, companies with high revenue multiples do beat the Rule of 40. Looking at the top right quadrant of the chart above, you’ll see that companies in this quadrant had the highest median revenue multiple of any quadrant at 14.3x.
On an individual company level, we generally see higher multiples above the Rule of 40 line. However, there are some exceptions like ZOOM, which beats the Rule of 40, but still has a lower multiple of 6.5x. You can read more about exceptions to the Rule of 40 here. This indicates that the Rule of 40 is a surface metric and can provide base-level insights that should then be investigated further.
Second, the Rule of 40 is relatively hard to beat, and it is getting harder over time. Of the 80+ publicly-traded SaaS companies tracked in our index, only 16 beat the Rule of 40. That’s only 19%.
Third, and perhaps most importantly, we appear to be back in a place where the public markets are putting an emphasis on BOTH growth and profitability – a departure from the market’s predominantly growth-focused valuation mindset of the last few years. Low Growth, Profitable businesses (median EV / Revenue: 12.3x) are now more highly valued than High Growth, Less Profitable (10.1x). High Growth, Profitable continues to command a premium (14.3x), while Low Growth, Less Profitable trade at a deep discount to the balance of the SaaS market (5.8x).
Benchmark your Company against the rule of 40 index
We’re especially excited to allow you to get in on the action. Using our Rule of 40 Calculator, you can interactively compare your company’s Rule of 40 results to that of each of these publicly-traded SaaS companies. Simply scroll to the bottom of the page, enter in your growth and EBITDA margin, and the calculator will plot your metrics on the graph, giving you your own Rule of 40 score.
You can even filter by industry to compare yourself against a relevant set of companies. Feel free to play around with the Index as there are lots of insights that you can uncover.
Though not perfect, the Rule of 40 is a useful metric. Companies should evaluate their specific market, and capital availability, to determine if sacrificing short-term profitability in pursuit of responsible growth is the correct decision. Growth at all costs introduces financing risk and assumes that capital will remain readily available to fund continued losses.
As noted by Volition’s Larry Cheng, market conditions can change rapidly and companies are introducing material risk when they are dependent on future financings. The best entrepreneurs will balance their business needs with the market forces around them.
