With baseball season about a quarter done and summer upon us, I wanted to share some of the similarities between venture capital and baseball. We often think about capital efficient businesses being conservative and playing defense until the sales efficiency metrics are proven and then go on offense and raise capital to aggressively capture the opportunity.
Growth provides increased flexibility to raise incremental capital, and it is the cash that provides the fuel to step on the gas and go for it. When on defense, one often plays more conservative to extend cash runway until sales metrics are demonstrated or to help navigate through a tough market environment. This offensive and defensive mentality is what can separate winning from losing.
No surprise that as an emerging company or a baseball team, playing well on offense and defense is a winning strategy. In the venture business, if you offensively deliver strong growth and balance that with robust margins, you have a great chance of winning and creating significant shareholder value. On the defensive side, if you maintain capital efficiency, make changes when needed and execute better than the competition, you also have a great chance to outperform.
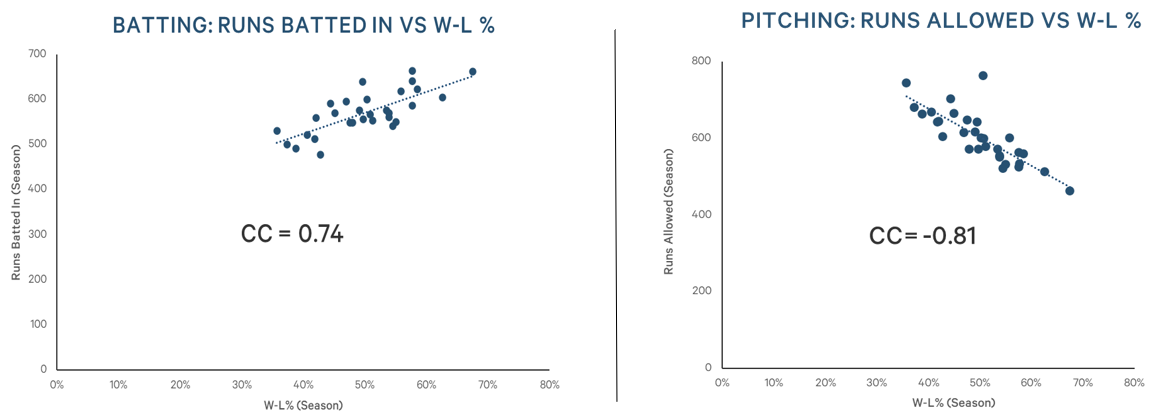
As you can see in the charts below, this also applies in baseball as well. There is a strong positive correlation coefficient between runs batted in and winning as well as a strong negative correlation between pitching giving up a low number of runs and winning.

Outs in baseball and cash in venture businesses keep the game going. What I love about baseball, unlike in basketball, football or hockey, is that there is no clock. If you have at least one of your 27 outs remaining in a 9 inning game, you have a chance to win. With cash, there is a chance to capture the opportunity, and without it, the business is over. While getting off to a slow start could put the team in a tough position, there is time to overcome it and still have a big win.
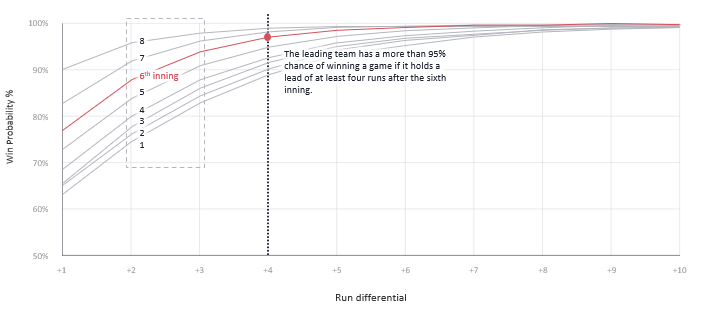
However, it is hard to fall behind too often and win. This is shown in the following chart which shows teams have almost a 90% chance of losing when down by 2 runs after 6 innings.

To avoid falling behind, the key to success is to act quickly and not let issues fester. Companies need to act with a sense of urgency as time is of the essence. An example is when a company gets ahead of itself and needs to reduce headcount. Just get it done, motivate the go-forward team and often the remaining team will get more done with less.
Also, companies often need to experiment to find the right product-market fit or its growth drivers. Businesses will make mistakes along this journey. Mistakes are good and inevitable so long as you learn from them to better execute against your strategy.
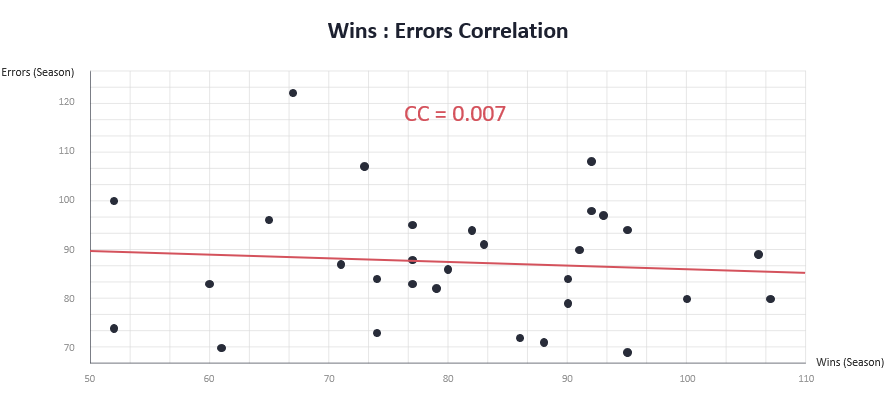
Last analogy to baseball. While one might suspect that errors result in a higher loss rate, there is minimal correlation to errors committed and winning or losing, as shown below:

Whether in venture capital or baseball, I love winning and hate losing. Go Yanks.
Chart Data Sources: Batting & Pitching: Baseball-Reference.com. Statistics represent the team’s average from 2019 – 2021. Probability that the winning team goes on to win: FiveThirtyEight, 2010-2015 Regular Season Ending Data. Wins : Errors Correlation: Samford.edu, 2021 MLB Season

